


We study
mobility
hospital
social
data with regards to Covid-19 forecasting.
Hamsika Rammohan, Kai Ouyang, Lasya Venneti,
Oswin So, Sanjeev Rao
Proposal
Introduction / Background
Coronavirus disease 2019 (COVID-19) is rapidly spreading across the globe and is a significant public health threat to humanity infecting millions worldwide. We'll be using machine learning to build models which will be used to forecast casualty rates given novel datasets built from mobility, hospital, and social media data feeds.
Problem Definition
In August, Florida changed how it reported deaths to the CDC by simply reporting “new deaths” they had processed, regardless of what day they actually happened. Since it takes several weeks for data on deaths to be processed, data shown by CDC for the state can show that deaths are falling, even during major outbreaks. (Mendelson, 2021) As such, we aim to build machine learning models to forecast casualty rates by training the model on non-Florida data.Using mean absolute error (MAE), and root mean squared error (RMSE) as our loss function, we hope to measure the efficacy of our models. Should the forecasts prove prescient, we hope that the models can be used by public health officials to quickly mitigate near-term issues affecting their community.
Methods
Data Collection
We have collected and preprocessed data from the following sources:| Source | Granularity | Columns | Rows | Data Size |
|---|---|---|---|---|
| JHU | State | 17 | 27435 | 1.8 GB |
| Google Data | County | 15 | 812066 | 0.4 GB |
| Apple Data | County | 675 | 4792 | 0.5 GB |
| CDC | State | 15 | 39061 | 0.8 GB |
Data Generation with SIR Modelling
The Susceptible, Infectious, Recovered model is an epidemiology model for modelling the spread of disease within a population. The model consists of three "compartments":
- Susceptible
- The number of susceptible individuals. These individuals will become infected after coming into contact with an infectious individual.
- Infectious
- The number of infectious individuals. These individuals are infected and are capable of infecting susceptible individuals.
- Recovered
- The number of recovered or deceased individuals. These are either immune or deceased individuals who cannot become infectious again.
The system can be described as the following coupled system of ODE $$ \begin{cases} \frac{dS}{dt} = - \beta \frac{IS}{N}, \\ \frac{dI}{dt} = \frac{\beta I S}{N} - \gamma I, \\ \frac{dR}{dt} = \gamma I, \end{cases} $$ where $S$, $I$ and $R$ denotes the number of susceptible, infected and recovered individuals respectively, $N = S + I + R$ is the total population, $\beta$ denotes the infectious rate and $\gamma$ denotes the recovery rate.
We fit the SIR model using the infected and death rate from the CDC and JHU sources to obtain a value of $\beta$ and $\gamma$ from each source for three time intervals: 7, 14 and 30 days. The fitting was performed using scipy.optimize package in python,
resulting in 4 columns of data for all 314 days. This data will be used for predicting future infection and casualty numbers.
Data Processing
Cleaning
We first cleaned up the data from various sources into a consistent format. The raw data from the JHU dataset for one of the dates is shown below. In particular, note the missing values for the People_Hospitalized column.
| Province_State | Country_Region | Last_Update | Lat | Long_ | Confirmed | Deaths | Recovered | Active | FIPS | Incident_Rate | Total_Test_Results | People_Hospitalized | Case_Fatality_Ratio | UID | ISO3 | Testing_Rate | Hospitalization_Rate |
|---|---|---|---|---|---|---|---|---|---|---|---|---|---|---|---|---|---|
| Alabama | US | 2021-01-02 05:30:44 | 32.3182 | -86.9023 | 365747 | 4872 | 202137.0 | 158738.0 | 1.0 | 7459.375895463867 | 3275341.0 | 1.3320683423240656 | 84000001.0 | USA | 66800.27369964625 | ||
| Alaska | US | 2021-01-02 05:30:44 | 61.3707 | -152.4044 | 47019 | 206 | 7165.0 | 39615.0 | 2.0 | 6422.844801071706 | 1275750.0 | 0.4384284680543141 | 84000002.0 | USA | 174391.1857780451 | ||
| American Samoa | US | 2021-01-02 05:30:44 | -14.271 | -170.132 | 0 | 0 | 0.0 | 60.0 | 0.0 | 2140.0 | 16.0 | ASM | 3846.084721698028 | ||||
| Arizona | US | 2021-01-02 05:30:44 | 33.7298 | -111.4312 | 530267 | 9015 | 76934.0 | 444318.0 | 4.0 | 7285.171274003372 | 5155330.0 | 1.7000869373353424 | 84000004.0 | USA | 39551.860582022906 | ||
| Arkansas | US | 2021-01-02 05:30:44 | 34.9697 | -92.3731 | 229442 | 3711 | 199247.0 | 26484.0 | 5.0 | 7602.945718144717 | 2051488.0 | 1.6174022192972517 | 84000005.0 | USA | 67979.49767446793 | ||
| California | US | 2021-01-02 05:30:44 | 36.1162 | -119.6816 | 2437084 | 26168 | 2309915.0 | 6.0 | 5912.603297465698 | 33058311.0 | 1.1251600354592777 | 84000006.0 | USA | 83666.03670970372 | |||
| Colorado | US | 2021-01-02 05:30:44 | 39.0598 | -105.3111 | 337161 | 4873 | 18102.0 | 314186.0 | 8.0 | 5854.774381044729 | 4444206.0 | 1.4453035790023163 | 84000008.0 | USA | 77173.28941628858 | ||
| Connecticut | US | 2021-01-02 05:30:44 | 41.5978 | -72.7554 | 185708 | 5995 | 9800.0 | 169913.0 | 9.0 | 5208.781228551867 | 4320693.0 | 3.2281861847631768 | 84000009.0 | USA | 121187.80339422885 | ||
| Delaware | US | 2021-01-02 05:30:44 | 39.3185 | -75.5071 | 58064 | 1065 | 18851.0 | 38283.0 | 10.0 | 5962.841099075341 | 984606.0 | 1.6016809038302562 | 84000010.0 | USA | 101113.41146314713 | ||
| Diamond Princess | US | 2021-01-02 05:30:44 | 49 | 0 | 49.0 | 88888.0 | 0.0 | 84088888.0 | USA | ||||||||
| District of Columbia | US | 2021-01-02 05:30:44 | 38.8974 | -77.0268 | 29252 | 788 | 20941.0 | 7523.0 | 11.0 | 4144.816358223675 | 904302.0 | 2.6938329003145083 | 84000011.0 | USA | 128133.65658328953 | ||
| Florida | US | 2021-01-02 05:30:44 | 27.7663 | -81.6868 | 1323315 | 21673 | 1301642.0 | 12.0 | 6161.333477544677 | 17392558.0 | 1.6377808760574768 | 84000012.0 | USA | 80979.47190618825 | |||
| Georgia | US | 2021-01-02 05:30:44 | 33.0406 | -83.6431 | 677589 | 10958 | 666631.0 | 13.0 | 6381.859326881861 | 5401054.0 | 1.6172045295894708 | 84000013.0 | USA | 50869.726109621886 | |||
| Grand Princess | US | 2021-01-02 05:30:44 | 103 | 3 | 100.0 | 99999.0 | 2.9126213592233015 | 84099999.0 | USA | ||||||||
| Guam | US | 2021-01-02 05:30:44 | 13.4443 | 144.7937 | 7326 | 122 | 7047.0 | 157.0 | 66.0 | 4460.844308861407 | 96201.0 | 1.6653016653016652 | 316.0 | GUM | 58577.35235555231 | ||
| Hawaii | US | 2021-01-02 05:30:44 | 21.0943 | -157.4983 | 22397 | 289 | 11958.0 | 9775.0 | 15.0 | 1555.366586810107 | 816811.0 | 1.3123240395967668 | 84000015.0 | USA | 57689.60753514442 | ||
| Idaho | US | 2021-01-02 05:30:44 | 44.2405 | -114.4788 | 141077 | 1436 | 58649.0 | 80992.0 | 16.0 | 7894.34072067888 | 545485.0 | 1.0178838506631132 | 84000016.0 | USA | 30524.071592247623 | ||
| Illinois | US | 2021-01-02 05:30:44 | 40.3495 | -88.9861 | 963389 | 17978 | 945411.0 | 17.0 | 7602.6089699341555 | 13374665.0 | 1.866120539055356 | 84000017.0 | USA | 105546.51142878359 | |||
| Indiana | US | 2021-01-02 05:30:44 | 39.8494 | -86.2583 | 517773 | 9468 | 345474.0 | 163928.0 | 18.0 | 7690.970837401457 | 5730043.0 | 1.6167316565367449 | 84000018.0 | USA | 85113.7344165423 | ||
| Iowa | US | 2021-01-02 05:30:44 | 42.0115 | -93.2105 | 282980 | 3898 | 241229.0 | 37853.0 | 19.0 | 8969.056154063142 | 1174406.0 | 1.3774825075977102 | 84000019.0 | USA | 37222.81914505859 | ||
| Kansas | US | 2021-01-02 05:30:44 | 38.5266 | -96.7265 | 230108 | 2892 | 4612.0 | 222819.0 | 20.0 | 7905.189759840511 | 1012506.0 | 1.2470527956648416 | 84000020.0 | USA | 34754.441162195355 | ||
| Kentucky | US | 2021-01-02 05:30:44 | 37.6681 | -84.6701 | 265261 | 2623 | 36740.0 | 225898.0 | 21.0 | 5937.341430315066 | 3148606.0 | 0.9888374091932096 | 84000021.0 | USA | 70475.30112432133 | ||
| Louisiana | US | 2021-01-02 05:30:44 | 31.1695 | -91.8678 | 315275 | 7488 | 263712.0 | 44075.0 | 22.0 | 6781.866436757577 | 4214182.0 | 2.375069383871224 | 84000022.0 | USA | 90651.08068888405 | ||
| Maine | US | 2021-01-02 05:30:44 | 44.6939 | -69.3819 | 24902 | 352 | 11374.0 | 13176.0 | 23.0 | 1852.535165584 | 1111413.0 | 1.4135410810376676 | 84000023.0 | USA | 82681.37763983657 | ||
| Maryland | US | 2021-01-02 05:30:44 | 39.0639 | -76.8021 | 280219 | 5942 | 9358.0 | 264919.0 | 24.0 | 4635.028648555663 | 5761534.0 | 2.1204843354661893 | 84000024.0 | USA | 95300.01587910707 | ||
| Massachusetts | US | 2021-01-02 05:30:44 | 42.2302 | -71.5301 | 375178 | 12423 | 261672.0 | 101083.0 | 25.0 | 5443.276557152025 | 10944699.0 | 3.3112282703143574 | 84000025.0 | USA | 158791.3563476142 | ||
| Michigan | US | 2021-01-02 05:30:44 | 43.3266 | -84.5361 | 528621 | 13018 | 318389.0 | 197214.0 | 26.0 | 5293.166809137249 | 8113075.0 | 2.4626339097387357 | 84000026.0 | USA | 81237.52047315787 | ||
| Minnesota | US | 2021-01-02 05:30:44 | 45.6945 | -93.9002 | 415302 | 5382 | 397080.0 | 12840.0 | 27.0 | 7363.9911256621 | 5351379.0 | 1.2959244116329804 | 84000027.0 | USA | 94888.79770878667 | ||
| Mississippi | US | 2021-01-02 05:30:44 | 32.7416 | -89.6787 | 218386 | 4816 | 167263.0 | 46307.0 | 28.0 | 7337.871860582249 | 1346044.0 | 2.2052695685620867 | 84000028.0 | USA | 45227.70869334835 | ||
| Missouri | US | 2021-01-02 05:30:44 | 38.4561 | -92.2884 | 445019 | 5747 | 397080.0 | 4684.0 | 29.0 | 6639.214341903481 | 3665980.0 | 1.402042323861224 | 84000029.0 | USA | 59731.53575080637 | ||
| Montana | US | 2021-01-02 05:30:44 | 46.9219 | -110.4544 | 81555 | 961 | 74991.0 | 5603.0 | 30.0 | 7630.677278162537 | 791589.0 | 1.1783459015388391 | 84000030.0 | USA | 74064.86660466438 | ||
| Nebraska | US | 2021-01-02 05:30:44 | 41.1254 | -98.2681 | 167716 | 1668 | 107694.0 | 58354.0 | 31.0 | 8670.146111885393 | 1755820.0 | 0.994538386319731 | 84000031.0 | USA | 90767.82147302947 | ||
| Nevada | US | 2021-01-02 05:30:44 | 38.3135 | -117.0554 | 227046 | 3143 | 223903.0 | 32.0 | 7371.250027596005 | 2095778.0 | 1.3843009786563076 | 84000032.0 | USA | 68041.29401238119 | |||
| New Hampshire | US | 2021-01-02 05:30:44 | 43.4525 | -71.5639 | 45932 | 759 | 37350.0 | 5919.0 | 33.0 | 3238.0410248942608 | 1032929.0 | 1.7239029708367402 | 84000033.0 | USA | 75966.80471070691 | ||
| New Jersey | US | 2021-01-02 05:30:44 | 40.2989 | -74.521 | 535043 | 19160 | 56109.0 | 407592.0 | 34.0 | 5436.2831689031655 | 7792714.0 | 3.968015640111751 | 84000034.0 | USA | 87734.15114966016 | ||
| New Mexico | US | 2021-01-02 05:30:44 | 34.8405 | -106.2485 | 144142 | 2502 | 66638.0 | 75002.0 | 35.0 | 6874.284932152312 | 1983507.0 | 1.7357883198512578 | 84000035.0 | USA | 94595.55357160741 | ||
| New York | US | 2021-01-02 05:30:44 | 42.1657 | -74.9481 | 995816 | 37973 | 102968.0 | 854693.0 | 36.0 | 5118.939406517912 | 25504313.0 | 3.8315311262321554 | 84000036.0 | USA | 131103.5701895401 | ||
| North Carolina | US | 2021-01-02 05:30:44 | 35.6301 | -79.8064 | 539545 | 6748 | 403488.0 | 129309.0 | 37.0 | 5144.3619254002915 | 6944103.0 | 1.2506834462371073 | 84000037.0 | USA | 66209.45255587198 | ||
| North Dakota | US | 2021-01-02 05:30:44 | 47.5289 | -99.784 | 92770 | 1316 | 89314.0 | 2147.0 | 38.0 | 12173.550183580865 | 1277930.0 | 1.4110164924005606 | 84000038.0 | USA | 167693.70471169017 | ||
| Northern Mariana Islands | US | 2021-01-02 05:30:44 | 15.0979 | 145.6739 | 122 | 2 | 29.0 | 91.0 | 69.0 | 221.2389380530973 | 17551.0 | 1.639344262295082 | 580.0 | MNP | 31827.57870303206 | ||
| Ohio | US | 2021-01-02 05:30:44 | 40.3888 | -82.7649 | 700380 | 13766 | 556106.0 | 135312.0 | 39.0 | 5991.735890701594 | 7752314.0 | 1.279591079128473 | 84000039.0 | USA | 66320.88013619526 | ||
| Oklahoma | US | 2021-01-02 05:30:44 | 35.5653 | -96.9289 | 291209 | 2489 | 255843.0 | 32604.0 | 40.0 | 7352.492601032456 | 2685254.0 | 0.8555146148981221 | 84000040.0 | USA | 67861.35152367808 | ||
| Oregon | US | 2021-01-02 05:30:44 | 44.572 | -122.0709 | 113909 | 1477 | 5870.0 | 106562.0 | 41.0 | 2700.713676552142 | 2652670.0 | 1.2966490795283954 | 84000041.0 | USA | 62893.20552703974 | ||
| Pennsylvania | US | 2021-01-02 05:30:44 | 40.5908 | -77.2098 | 653260 | 16245 | 429017.0 | 206919.0 | 42.0 | 5093.669429023879 | 7607664.0 | 2.477414962022172 | 84000042.0 | USA | 30645.581713903983 | ||
| Puerto Rico | US | 2021-01-02 05:30:44 | 18.2208 | -66.5901 | 77054 | 1521 | 66930.0 | 8603.0 | 72.0 | 2412.69201119456 | 1386353.0 | 1.973940353518312 | 630.0 | PRI | 43409.07425695762 | ||
| Rhode Island | US | 2021-01-02 05:30:44 | 41.6809 | -71.5118 | 87949 | 1944 | 5381.0 | 80791.0 | 44.0 | 8302.080216281325 | 1974498.0 | 2.020489147119353 | 84000044.0 | USA | 186385.75518638126 | ||
| South Carolina | US | 2021-01-02 05:30:44 | 33.8569 | -80.945 | 307507 | 5296 | 151084.0 | 151127.0 | 45.0 | 5972.501094448051 | 3173021.0 | 1.7222372173641576 | 84000045.0 | USA | 61627.44716447641 | ||
| South Dakota | US | 2021-01-02 05:30:44 | 44.2998 | -99.4388 | 99164 | 1488 | 91980.0 | 5696.0 | 46.0 | 11209.290811487816 | 372640.0 | 1.5005445524585534 | 84000046.0 | USA | 42122.444919454836 | ||
| Tennessee | US | 2021-01-02 05:30:44 | 35.7478 | -86.6923 | 586802 | 6907 | 508914.0 | 70981.0 | 47.0 | 8592.576496074049 | 5644058.0 | 1.1770580195704854 | 84000047.0 | USA | 82646.27610894085 | ||
| Texas | US | 2021-01-02 05:30:44 | 31.0545 | -97.5635 | 1782956 | 28359 | 1435164.0 | 316178.0 | 48.0 | 6137.40620607458 | 13848790.0 | 1.5876084165217368 | 84000048.0 | USA | 47761.232017747614 | ||
| Utah | US | 2021-01-02 05:30:44 | 40.15 | -111.8624 | 276612 | 1269 | 224439.0 | 50904.0 | 49.0 | 8628.060629615236 | 2245303.0 | 0.4587653464057959 | 84000049.0 | USA | 70035.32173534401 | ||
| Vermont | US | 2021-01-02 05:30:44 | 44.0459 | -72.7107 | 7412 | 136 | 4959.0 | 2317.0 | 50.0 | 1187.8414523332942 | 697705.0 | 1.834862385321101 | 84000050.0 | USA | 111813.66979225595 | ||
| Virgin Islands | US | 2021-01-02 05:30:44 | 18.3358 | -64.8963 | 2036 | 23 | 1901.0 | 112.0 | 78.0 | 1898.0497445650146 | 36212.0 | 1.1296660117878192 | 850.0 | VIR | 33758.4368124697 | ||
| Virginia | US | 2021-01-02 05:30:44 | 37.7693 | -78.17 | 354766 | 5081 | 30964.0 | 318721.0 | 51.0 | 4156.349485016671 | 4291320.0 | 1.4322116550063986 | 84000051.0 | USA | 50276.02890931413 | ||
| Washington | US | 2021-01-02 05:30:44 | 47.4009 | -121.4905 | 246752 | 3461 | 243291.0 | 53.0 | 3240.3869627583736 | 3836820.0 | 1.402622876410323 | 84000053.0 | USA | 50385.73752776303 | |||
| West Virginia | US | 2021-01-02 05:30:44 | 38.4912 | -80.9545 | 87820 | 1361 | 60316.0 | 26143.0 | 54.0 | 4900.2676677750205 | 1535487.0 | 1.5497608745160556 | 84000054.0 | USA | 85678.63015701277 | ||
| Wisconsin | US | 2021-01-02 05:30:44 | 44.2685 | -89.6165 | 522523 | 5254 | 450358.0 | 66911.0 | 55.0 | 8974.3052475992 | 5380828.0 | 1.0055059777272959 | 84000055.0 | USA | 92415.44000327012 | ||
| Wyoming | US | 2021-01-02 05:30:44 | 42.756 | -107.3025 | 44409 | 438 | 42570.0 | 1401.0 | 56.0 | 7673.142015934093 | 501784.0 | 0.9862865635344188 | 84000056.0 | USA | 86699.99084247503 |
The first 5 rows of the cleaned dataset for Georgia is shown below.
| date | Georgia-apple-driving | Georgia-apple-walking | Georgia-google-retail_and_recreation | Georgia-google-grocery_and_pharmacy | Georgia-google-parks | Georgia-google-transit_stations | Georgia-google-workplaces | Georgia-google-residential | Georgia-jh_beta_7 | Georgia-jh_gamma_7 | Georgia-cdc_beta_7 | Georgia-cdc_gamma_7 | Georgia-jh_beta_14 | Georgia-jh_gamma_14 | Georgia-cdc_beta_14 | Georgia-cdc_gamma_14 | Georgia-jh_beta_30 | Georgia-jh_gamma_30 | Georgia-cdc_beta_30 | Georgia-cdc_gamma_30 | Georgia-census_pop | Georgia-jh_confirmed | Georgia-jh_death | Georgia-cdc_confirmed | Georgia-cdc_death | Georgia-jh_confirmed_ratio | Georgia-jh_death_ratio | Georgia-cdc_confirmed_ratio | Georgia-cdc_death_ratio |
|---|---|---|---|---|---|---|---|---|---|---|---|---|---|---|---|---|---|---|---|---|---|---|---|---|---|---|---|---|---|
| 01-01-2021 | 101.84 | 140.75 | -45.0 | -34.0 | -30.0 | -55.0 | -75.0 | 27.0 | 0.025 | 1e-05 | 0.025 | 1e-05 | 0.0250000014644707 | 3.693582180168887e-05 | 0.0250000014644707 | 3.693582180168887e-05 | 0.0250000073858855 | 7.275036489757106e-05 | 0.0250000073858855 | 7.275036489757106e-05 | 10617423 | 677589 | 10958 | 677589 | 10958 | 0.0638185932688186 | 0.0010320771810636 | 0.0638185932688186 | 0.0010320771810636 |
| 01-02-2021 | 139.0 | 180.17 | -19.0 | -12.0 | 4.0 | -19.0 | -20.0 | 8.0 | 0.025 | 1e-05 | 0.025 | 1e-05 | 0.0250000015275948 | 3.810728230091657e-05 | 0.0250000015275948 | 3.810728230091657e-05 | 0.025000007241244 | 7.146186053428295e-05 | 0.025000007241244 | 7.146186053428295e-05 | 10617423 | 685122 | 10960 | 685122 | 10960 | 0.0645280874652917 | 0.0010322655506896 | 0.0645280874652917 | 0.0010322655506896 |
| 01-03-2021 | 107.49 | 123.17 | -18.0 | -13.0 | -11.0 | -18.0 | -18.0 | 6.0 | 0.025 | 1e-05 | 0.025 | 1e-05 | 0.0250000015074641 | 3.7815304574038736e-05 | 0.0250000015074641 | 3.7815304574038736e-05 | 0.0250000068356669 | 6.782782007784836e-05 | 0.0250000068356669 | 6.782782007784836e-05 | 10617423 | 690900 | 10964 | 690900 | 10964 | 0.0650722873149162 | 0.0010326422899417 | 0.0650722873149162 | 0.0010326422899417 |
| 01-04-2021 | 118.12 | 138.63 | -12.0 | -4.0 | -8.0 | -27.0 | -33.0 | 10.0 | 0.025 | 1e-05 | 0.025 | 1e-05 | 0.0250000016398424 | 4.092979093371485e-05 | 0.0250000016398424 | 4.092979093371485e-05 | 0.0250000064307774 | 6.42923567543419e-05 | 0.0250000064307774 | 6.42923567543419e-05 | 10617423 | 696063 | 10971 | 696063 | 10971 | 0.065558563504534 | 0.0010333015836328 | 0.065558563504534 | 0.0010333015836328 |
| 01-05-2021 | 125.05 | 140.08 | -9.0 | 1.0 | 3.0 | -29.0 | -34.0 | 11.0 | 0.025 | 1e-05 | 0.025 | 1e-05 | 0.0250000016909018 | 4.245073559520049e-05 | 0.0250000016909018 | 4.245073559520049e-05 | 0.0250000060996839 | 6.147692877047476e-05 | 0.0250000060996839 | 6.147692877047476e-05 | 10617423 | 706154 | 11072 | 706154 | 11072 | 0.06650898245271 | 0.0010428142497477 | 0.06650898245271 | 0.0010428142497477 |
PCA
We next used PCA to perform dimension reduction on our dataset to retain 99% of the variance, resulting in a reduced set of 9-15 features. For Georgia, this resulted in 9 components. The correlation matrix of the features before and after PCA are shown below.
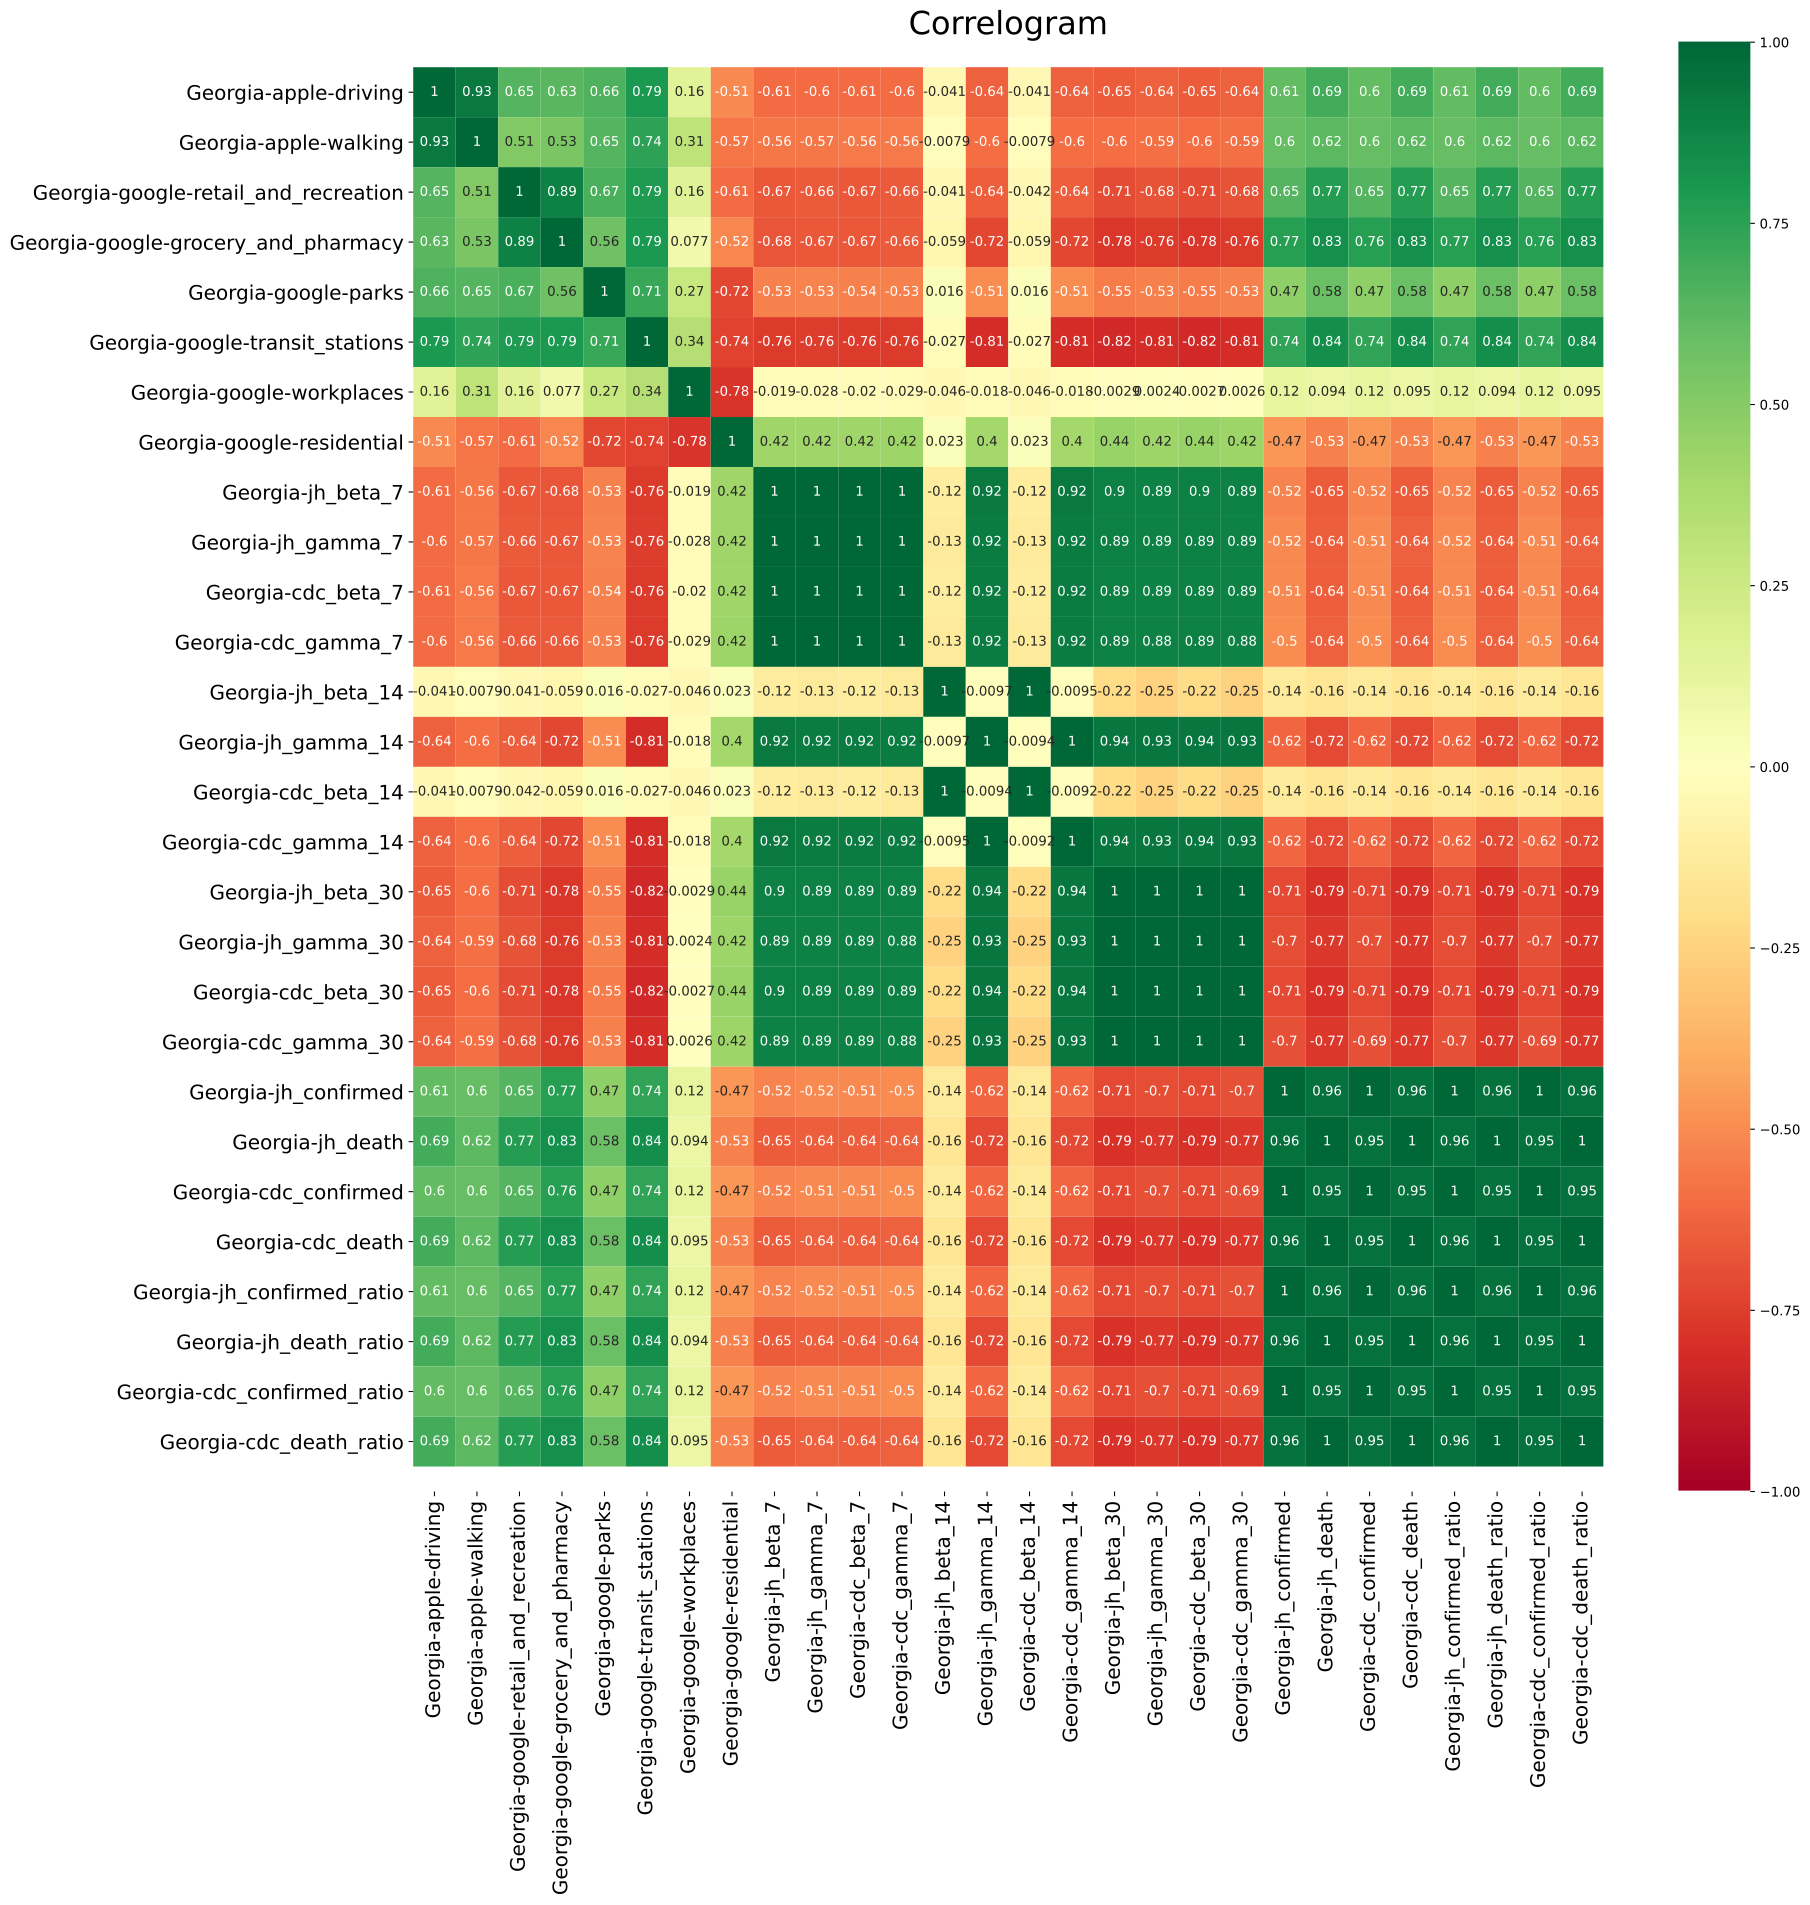
The correlation matrix of the pre-PCA features has large off-diagonal coefficients, indicating strong correlations between features. For example, the confirmed death rates and confirmed death ratios from JHU and CDC are basically identical, with values nearing 1. Similarly, the coefficients of the SIR model coefficients ($\beta$, $\gamma$) from JHU and CDC strongly correlate with each other with values nearing 1.
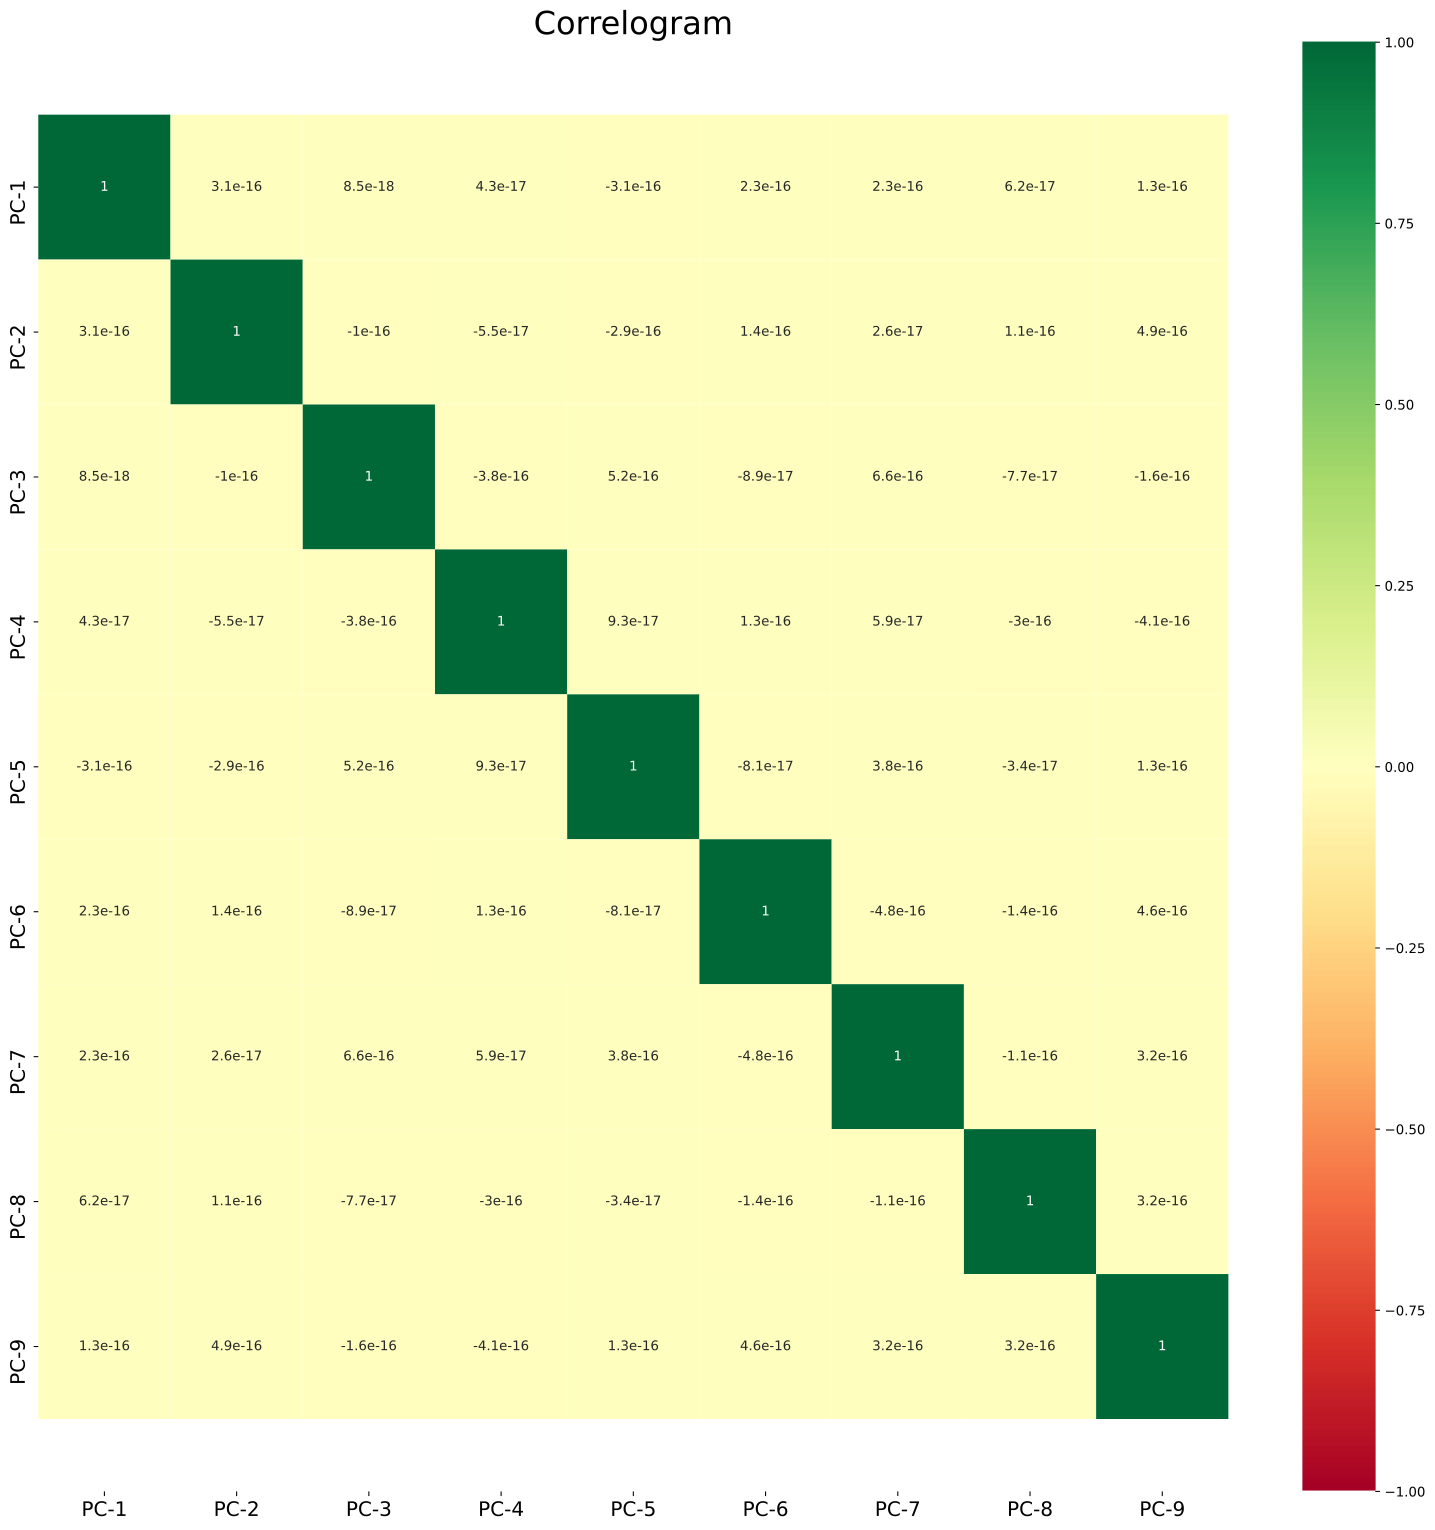
The correlation matrix of the reduced features is the identity matrix, confirming that PCA has found a set of uncorrelated feature vectors.
To gain more insight into the reduced features, we next visualize how each raw feature contributes to the different PCA components.
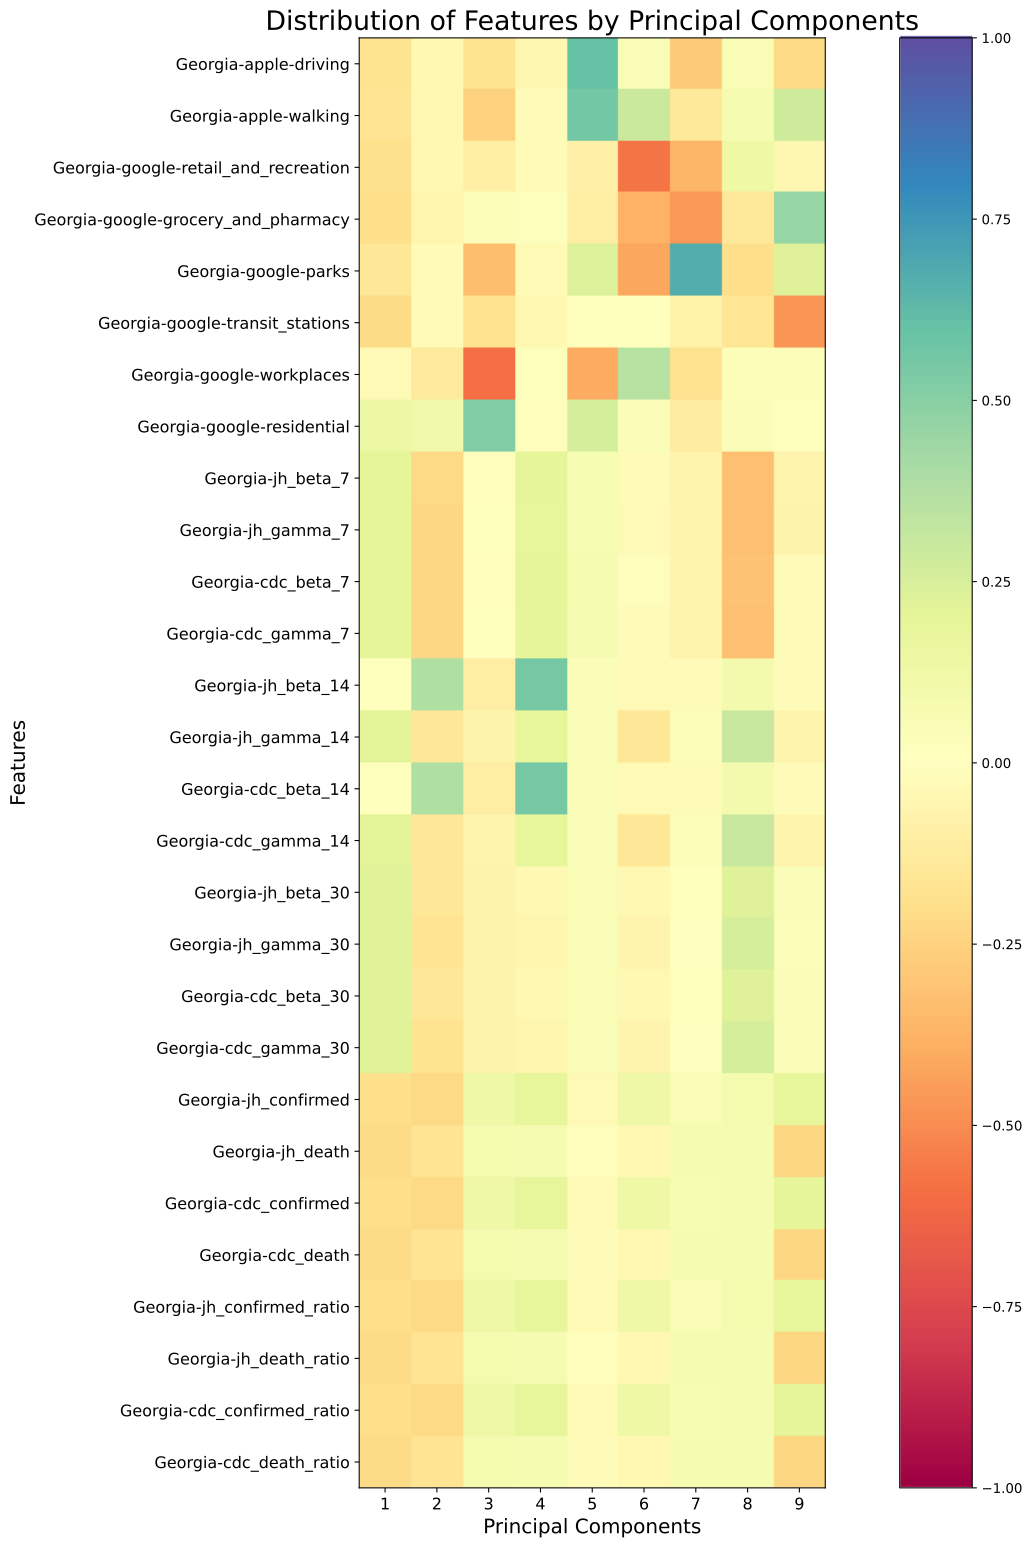
Some insights from this are that the SIR coefficients ($\beta$, $\gamma$) have the same direction in the each component. Also, the components for the google-workspaces and google-residences features are strong in opposite directions, matching intuition that staying at home should be equivalent to being away from the workplace.
Results
LSTM-based forecasting
We used PCA and reduced the number of features to 8 for every state. Using this newly generated data, we performed time series based predictions on Covid-19 deaths using LSTM.
Data Preparation
As we saw earlier, we have 50 states and 8 features for each state(from PCA). And every state has data from Jan 1 2021 to August 31 2021. Using this, we prepared the training dataset as follows.
Use
n_past = 30, the number of days in the past to consider for making predictionUse
n_future=1, number of days in the future we want our prediction to be.
Input to the mode is therefore of dimensions (batch_size, 30, 8) and the predictions will be of the form (batch_size, 1).
For example, data from April 1 to April 30 will be combined to a (30,8) vector which will be our input for
training and the number of deaths on May 1 will be the label and so on.
We scaled the data using MinMaxScaler from sklearn to scale all values between 0 and 1 before
PCA and training.
We can use the fit_inverse() function on the scaler to scale the results back to the original values.
Hyperparameters
We used the following hyperparameters for LSTM training:
| Name | Value |
|---|---|
| Optimizer | Adam |
| Learning Rate | 0.0001 |
| Loss | Mean Squared Error |
| Batch Size | 128 |
| Epochs | 256 |
The loss for the LSTM model is shown below.
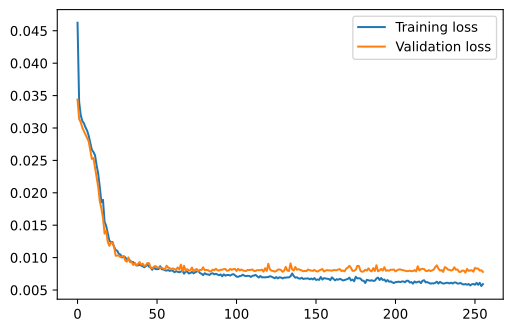
We chose one of the 50 states and predicted number of deaths for August 1 2021 to August 31 2021 and compared it with the reported number of deaths.
Predictions for some states were accurate (California, Louisiana) while not so much for some states (Colorado).
For most states, we see the predictions made by the LSTM model is either higher/lower than the actual number of deaths reported even though we see that the training and validation loss were less and did not vary significantly
Note that when the model was trained without scaling the data, the loss obtained was significantly off on the order of thousands. While scaling the data did make the loss seem to be less, by scaling the data back to the original vector space we see that the predictions are significantly off, which may indicate that the model is not predicting the deaths accurately.
As a result, we decided to use to decision tree / random forests instead.
Forecasting with Decision Trees / Random Forests
Using the same data, we next tried using the following variations on decision trees / random forests:
| Name | Description |
|---|---|
decisionTree | Decision Tree |
randomForest | Random Forest |
bagged_decisionTree | Bagged Decision Tree |
bagged_randomForest | Bagged RandomForest |
weightedEnsemble | Weighted ensemble model of the above methods |
The hyperparameters we used are shown below, corresponding to parameters to sklearn.tree.DecisionTreeClassifier:
| Name | Value |
|---|---|
criterion | "gini" |
splitter | "best" |
max_depth | None |
min_samples_split | 2 |
min_samples_leaf | 1 |
min_weight_fraction_leaf | 0.0 |
max_features | None |
random_state | None |
max_leaf_nodes | None |
min_impurity_decrease | 0.0 |
class_weight | None |
ccp_alpha | 0.0 |
The following hyperparameters are used for the random forest models (i.e. sklearn.ensemble.BaggingRegressor):
| Name | Value |
|---|---|
n_estimators | 10 |
max_samples | 1.0 |
max_features | 1.0 |
bootstrap | True |
The results for the decision tree / random forest methods are shown below:
Conclusion
We are using four different regressors.
- The first is the random tree decision tree, which produces a discrete model.
- The second model, a random forest, was applied as not to overfit the training data in forecasting.
- The bagged decision tree was bootstrapped, again, to provide some degree of noise in the modeling, and not to overfit the data. Lastly, we bootstrapped a bag of random forests – this randomized some of the features splitting, and randomly sampled the data as to prevent overfitting.
- Lastly, we applied a weighted ensemble learner, which weighted each regressor based on the RMSE value of the model.
As such, we expect that the decision tree to perform best with short term predictions, and random forest to perform better, the further away the prediction is. We find this to be true for most states. Further, we expect that the bagged random forest to almost always outperform the random forest, as it could account for outliers, and we find this to be true for almost all cases and for all states. The ensemble learner should always perform near the best for all states for all prediction ranges, and we find this to be true for nearly all cases. However, for some findings, we find that the decision tree RMSE to be nearly the same across the board for a specific time predictive time period. Likely, this means that the there isn’t much overfitting. For other states, random forest predictors have high rmse vs decision tree. This could be an outlier in some cases, however, in some states, random forest produced high rmse across multiple predictive time ranges, signifying that likely the decision tree is overfitting on training data. We would expect that the further out predictions are, the worse the performance of the modeling. This is true for almost all states except California and Maine. At first, we suspected this due to be due to Maines sparse data, however, as California also exhibits somewhat convex results on RMSE, we aren’t quite sure what conclusions to draw other than that either the models are not appropriate for these states, or more likely, the input data has errors (given that the modeling is consistent across almost all other states). We did see at the end of our modeling that our predicted values were always under the ground truth data. We later research and discovered this is because decision tree regressors always predict within the range of the values of which it is trained on. We immediately then thought that perhaps this explained the outliers with certain states with random forest, but upon inspection, we did not bootstrap those models, and thus confirm likely the input data for those states likely have errors. We now know that regressors cannot be used to extrapolate data, which does explain our predicted vs forecast results.
Using the features extracted by the PCA, we see that LSTM based Time Series Forecasting proved to be not useful in predicting COVID-19 death rates. From the graphs, we see that for most states the predictions were off by a large margin which made us shift our attention towards other supervised learning models like decision trees and random forests.
References
Mendelson, J. M. (2021, September 28). Florida’s illusion of recovery. Https://Observablehq.Com/. https://observablehq.com/@aloisius/floridas-illusion-of-recovery
Nakkiran, Preetum, et al. “Deep Double Descent: Where Bigger Models and More Data Hurt.” ArXiv.org, 4 Dec. 2019, https://arxiv.org/abs/1912.02292.
Warren, Michael, and Samuel Skillman. “Mobility Changes in Response to COVID-19 - Arxiv.” Mobility Changes in Response to COVID-19, ArXiv, 31 Mar. 2020, https://arxiv.org/pdf/2003.14228.pdf.
Our Timeline
Data collection and cleaning
- Oswin, Sanjeev - CDC data integration
- Lasya - Google Trend Data Integration
- Kai - Mobility Data Integration
- Hamsika - Integration Manager
Environment setup and testing
- Kai, Sanjeev, Hasmika - Google Colab setup / Random Forest learning initial implementation
- Kai, Oswin, Lasya - Data normalization, PCA, Hyperparameter tuning
Deep(er) learning
- Kai, Oswin, Hamsika - Ensemble initial implementation
- Sanjeev, Lasya - Bias / Variance tradeoff presentation
Hhhhhyper(parameter) tuning
- All - Grid Search
Black box wizardry
- All - model application to test sets and other states
It's a wrap!
- Oswin, Lasya - Data Presentation Preparation
- Kai, Sanjeev, Hamsika - SIR Modeling
Send it!
All - Begin project wrap up